Analyzing the MMR40 PTO – Spice vs Real World
Analyzing the MMR40 PTO – Spice vs Real World
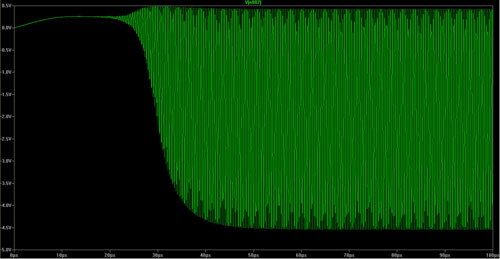
Some waveforms at startup from the spice model (Component designations from original manual, not spice model):
J310 Gate (Q14):
And here is the measured waveform at Q14 Gate (Ac Coupled):
And DC Coupled:
J310 Source (Q14):
J310 Source (Zoomed In):
And the Measured Waveform:
And DC Coupled:
Input to R3 (which represents U6 Oscillator Input):
Input to U6 (Zoomed in):
Measured Waveform (AC Coupled):
This shows a little lower level of signal, about 0.6vpp, due to the
capacitive loading of the scope probe at this point. The probe is about
10pf shunted across the 22pf capacitor on U6 pin 6. This gives us a
total of about 32pf. When I changed the 22pf capacitor in spice with a
32pf capacitor, it showed 0.6vpp, just like we are measuring.
And DC Coupled, It has a bit of a DC bias on it, probably from U6, which I didn’t model in spice for these tests:
R1/C9 point on cold end of tickler coil:
R1/C9 (Zoomed In):
And the measured waveform (AC Coupled) a little more ripple than predicted, but still very small:
And DC Coupled:
I really like using ltSpice to simulate real world circuits. It
allows me to change various values and see what effect it has on the
circuit.
As you can see, the Spice results come out very close to the real world
results, so using spice as an experimentation platform can save a lot of
time.


Comments
Post a Comment